Excel 2016: Helping Businesses...Well, Excel
No matter the size of your company, you’ve most likely used Excel to record data, manage projects, or track the performance of your business. When it comes to creating visual representations of data, Excel is universally the favorite among businesses.
And with the rollout of the new Excel 2016, it doesn’t look like that will change very soon.
This new version of the popular program is better than ever as it aims to please several types of business users, most notably those with big data to comprehend.
With updated charts and a more accessible version of its cloud-based business intelligence solution, Power BI, Microsoft has given us the tools to be efficient with our data and increase productivity overall.
Let’s take a look at some of the newest features of Excel 2016:
Forecasting with Seasonality
While the forecasting feature isn’t new to Excel, it is definitely improved. For users with a set of time-based series data, the “Forecast Sheet” command on the Data tab will create a new worksheet specifically showing a linear forecast of future trends.
Now, this new worksheet also incorporates seasonality and confidence intervals into your chart, thanks to the use of the Exponential Smoothing (ETS) algorithm.
New Chart Types
For users who appreciate visual representations of statistical or hierarchal data, Excel 2016 introduces new chart types such as Box and Whisker, Praeto, TreeMap, Sunburst, and Histograms. These can also be used in other Office 2016 programs like Word or PowerPoint, and they come with the multitude of formatting options available to the existing chart types.
With these innovative new options, business users will be able to create valuable and dynamic graphs, which will facilitate a keen understanding of their information.

Add-Ins That Are Now Built-Ins
Once referred to as Data Explorer, Power Query is now built in to Excel 2016 and enables users to import and transform data for a simpler self-service analyzation process. If you use websites like Facebook to gather statistical data, or want to import lists from SharePoint, Power Query easily inserts the information into your workbook.
3D Map, formerly known as the add-in Power Map, is a geospatial visualization tool that allows a user to turn location-specific data into a 3-dimensional map. These maps are useful if you want to know where your customers are located or need a better understanding of the geographical influences of sales.
Power BI
With all the new tools available, business users can be more efficient than ever. Not only can they import, transform, and analyze their data, but they’ll be able to share it all easily through an online dashboard called Power BI.
As a self-service business analytics tool, Power BI is an interactive cloud-based program that allows business partners to create and co-author reports and visualize statistics through a display of data tiles.
By publishing a report to Power BI, co-workers can collaborate with one another and stay abreast of ever-changing data, which can seriously cut down on the number of meetings day-to-day.
In fact, through these new time-saving features, Excel 2016 is an invaluable asset to professionals in several industries. By utilizing all the program has to offer, businesses can expect to see faster output and increased productivity.
New to Office 2016?
No problem.
QuickStart offers courses to help you and your team become proficient in any of Microsoft’s updated Office programs.
Enroll today and set your business on the fast track to success.
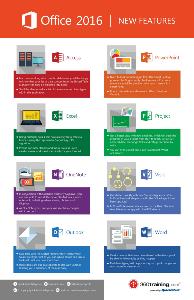
Click on the image below to see more new features from Office 2016!
