Are Your Statistics Up To Date?
This is not a personal question; it is about making sure that your SQL Server queries run at their most efficient. So, I suppose I should first explain a little about Statistics and how they are used in query optimization before I explain the rest. So, in this first part of the series, I will do just that.
When you create in index on a table, SQL Server automatically creates a Statistic for that index and names it the same as the index. In Figure 1 you see an example of this in a sample database I created called BurnsHoughton. You notice that the index PK_CustID (Clustered) has a Statistic named the same. I didn’t create that Statistic, SQL Server did it for me. (There is another situation in which SQL Server will create a Statistic for you, we will discuss that later.)

So, what do these Statistics do, anyway? Well, SQL Server uses them when it optimizes your queries. The Statistic tells the Query Optimizer information about what kind of data is in the table. It contains information about the column(s) on which the index is built. It tells the Optimizer whether the column(s) allow NULLs, the data type and size of the column(s), and it also lists whether the column involved is an identity column. Additionally, it contains information about the number of records and how they are dispersed (ranges). All of this helps the optimizer to decide whether to do a seek or a scan, whether to use this index or not, and which direction (Top-down or Bottom-up) to search the index information.
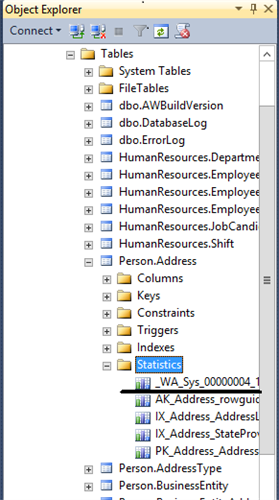
Sometimes you will look under the Statistics folder in Object Explorer and see something odd. You may see a Statistic that does not appear to be associated with any index, like the one in Figure 2.
The names of these new Statistics always start with _WA_. These are Statistics that SQL Server has created. Basically, the optimizer went to work on a query and found that there wasn’t an index that would work really well. In that case, it did some quick calculations and came up with its own Statistic. So, when you see a Statistic like this, it is an indicator that there might be an index that SQL Server could make good use of. That is not an absolute, just a suggestion.
It is entirely possible that the overhead of maintaining that missing index would be a bigger draw on resources than it be worth. This is where you would want to check with your DBA or do some further testing to determine whether or not it is worth it to create the index.

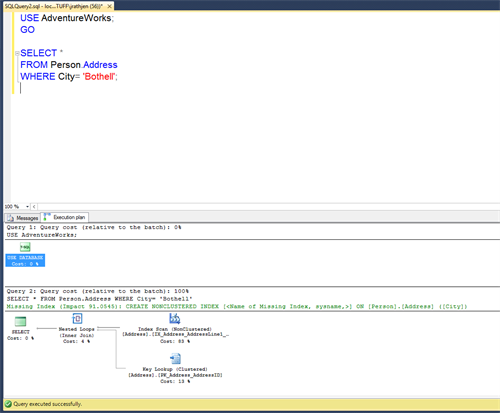
Another hint that you might need an additional or two can come when looking at the execution plan for a query. Notice that the execution plan shown in Figure 3 states that there is a missing index. Just like with the Statistic that is created by SQL Server in Figure 2, it may or may not be a good idea to create that index, it is just SQL Server’s way of suggesting that you take a look.

OK, so in Part 2 of this series on Statistics, I will take a look at what happens when those Statistics get stale, or out of date. I will wrap up in Part 3 with a discussion of how to tell when your Statistics get stale, and what you can do about it. Until then, have fun looking at these.
By the way, I should confess that when in college, I took a statistics class. The next quarter I took it again. Apparently the university thought that it was important that I actually get a passing grade. Also, a really cute girl was going to take the class that next quarter. I not only passed the class the second time around, I also married the cute girl. Win-Win.
Final confession, of all the times I typed the word 'statistics' in this discussion, I think I only spelled it correctly 2 or 3 times. Stupid Auto-Spell ought to have figured that out by now. Oh well, next time…